SEPTEMBER 2022 - REPORT
The rising frequency and intensity of crises calls for new insights
The Stability Index is comprised of three factors that serve as primary causes of performance variance: logistics, capacity, and supply. Each factor is a sub- index that contains variables that are drivers of behavior.
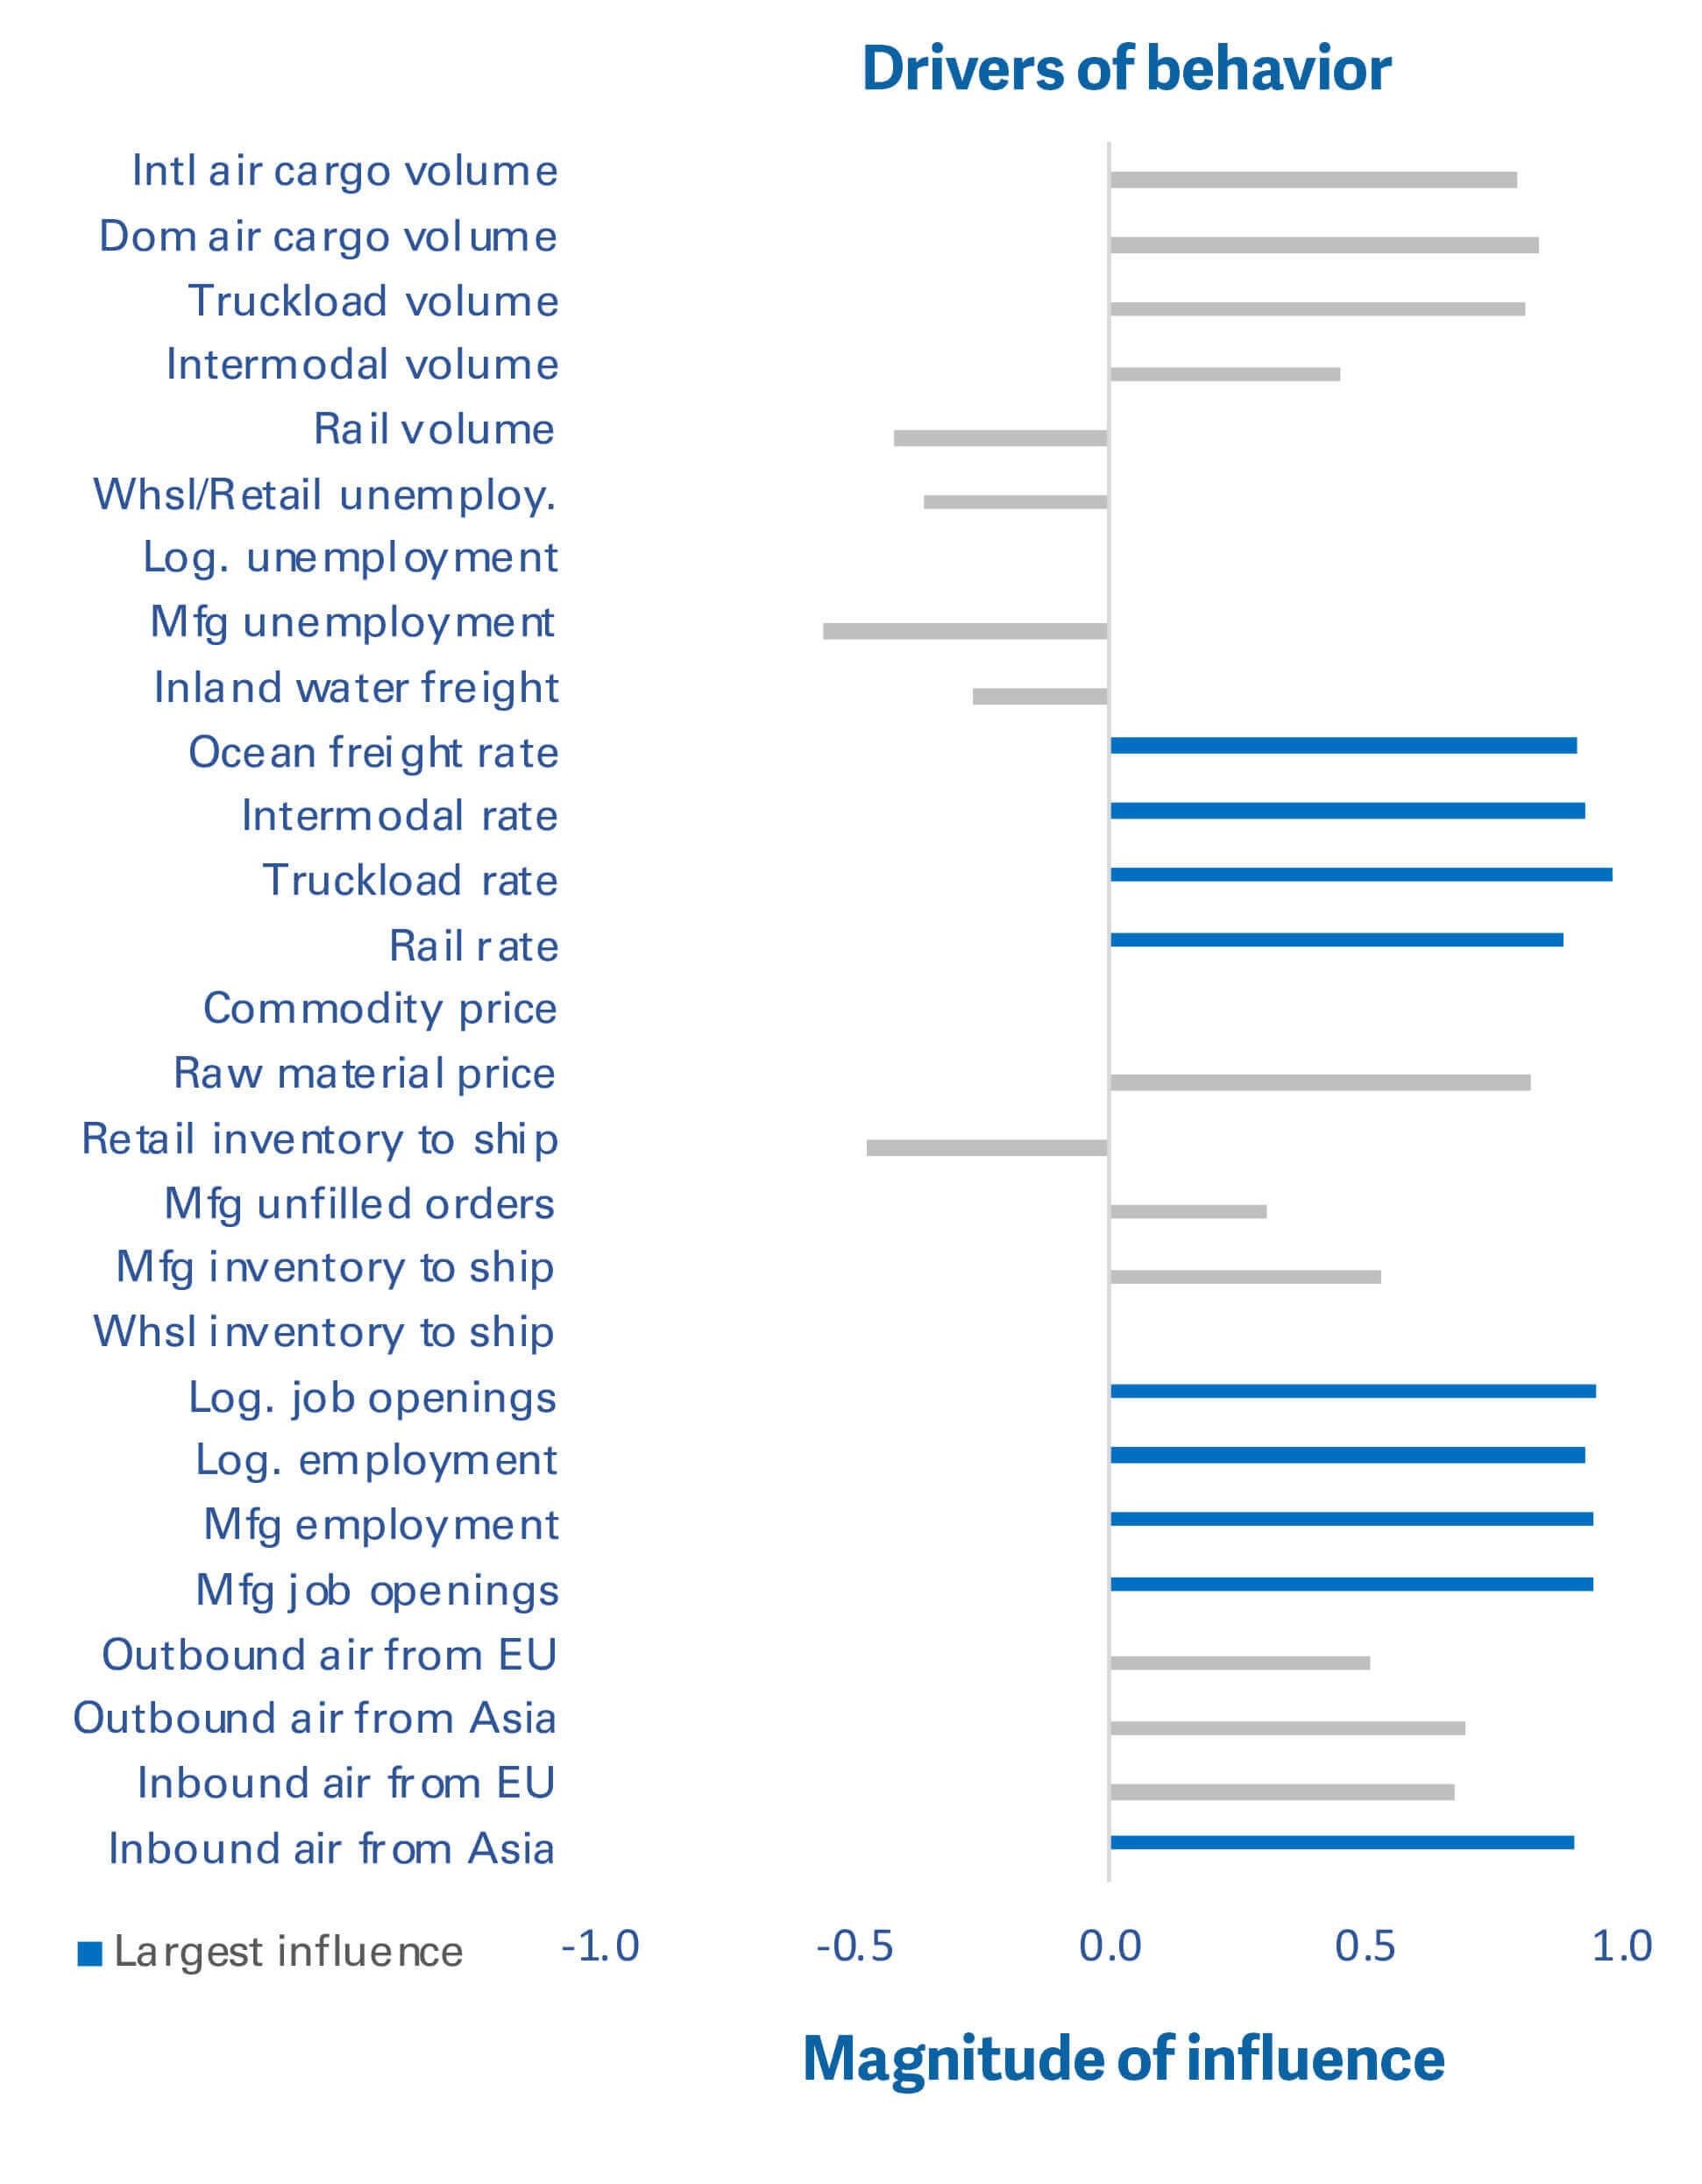
Logistics is the predominant cause of stress in supply chains across the United States, accounting for 71 percent of variability on average. Of that percentage, freight cost and labor are the primary drivers.
Ocean freight is the most cost-effective mode of transportation for international shipping. Over recent years, those rates increased while 44 percent of North American ports struggled at the bottom third in container port performance.iii This in turn drove companies to the costly yet speedier mode of air freight, which carries the highest carbon footprint amongst all modes. But the stress felt here was even more acutely targeted, where price and volume of U.S. inbound flights from Asia had the larger impact on stability—more so than any other air freight from any other region.
We find a similar trend with regards to trucking, where rates and volumes have the most dominant effect on domestic shipping. Since 2008, the trucking industry has experienced a two percent year-over-year (YoY) increase in price. In the past two years those prices increased by more than 45 percent, much of it being escalated by the Russia-Ukraine conflict and its impact on fuel commodity prices. During the same period, transportation job openings grew in response to ongoing shortages of truck drivers, which further compounded the stress on logistics operations.
But as it pertains to intermodal freight, the analytics attributes stress to higher rail prices, not volumes. Rail freight is known for efficiency and scale, but the tradeoff is speed and flexibility as it consumes more days in transit and lacks options with origin-destination (OD) pairs and schedules. Hence, shippers chose the customer responsiveness of truckloads over the cost efficiency and lower carbon footprint of rail, even in the face of inflationary pressure.
iii The Container Port Performance Index 2021, S&P Global Market Intelligence, 2022
Freight price and labor needs have the largest influence.
We find a similar trend with regards to trucking, where rates and volumes have the most dominant effect on domestic shipping. Since 2008, the trucking industry has experienced a two percent year-over-year (YoY) increase in price. In the past two years those prices increased by more than 45 percent, much of it being escalated by the Russia-Ukraine conflict and its impact on fuel commodity prices. During the same period, transportation job openings grew in response to ongoing shortages of truck drivers, which further compounded the stress on logistics operations.
But as it pertains to intermodal freight, the analytics attributes stress to higher rail prices, not volumes. Rail freight is known for efficiency and scale, but the tradeoff is speed and flexibility as it consumes more days in transit and lacks options with origin-destination (OD) pairs and schedules. Hence, shippers chose the customer responsiveness of truckloads over the cost efficiency and lower carbon footprint of rail, even in the face of inflationary pressure.
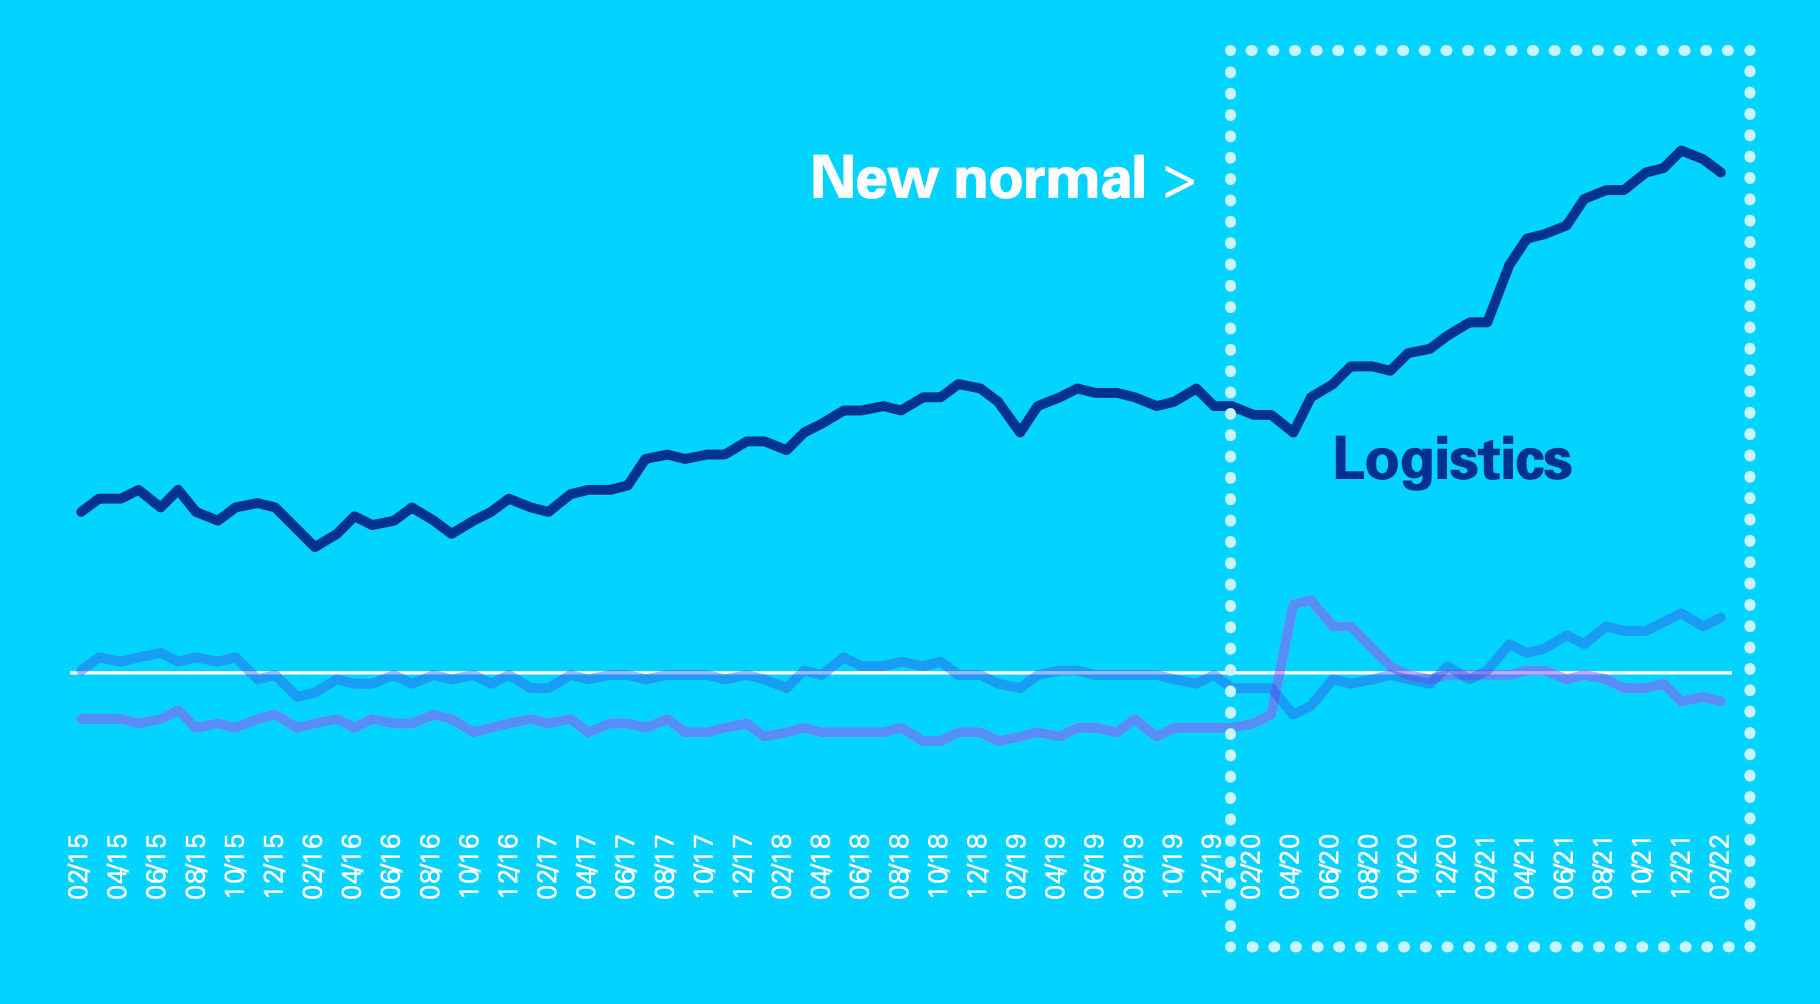
Logistics stress levels have accelerated in recent years.
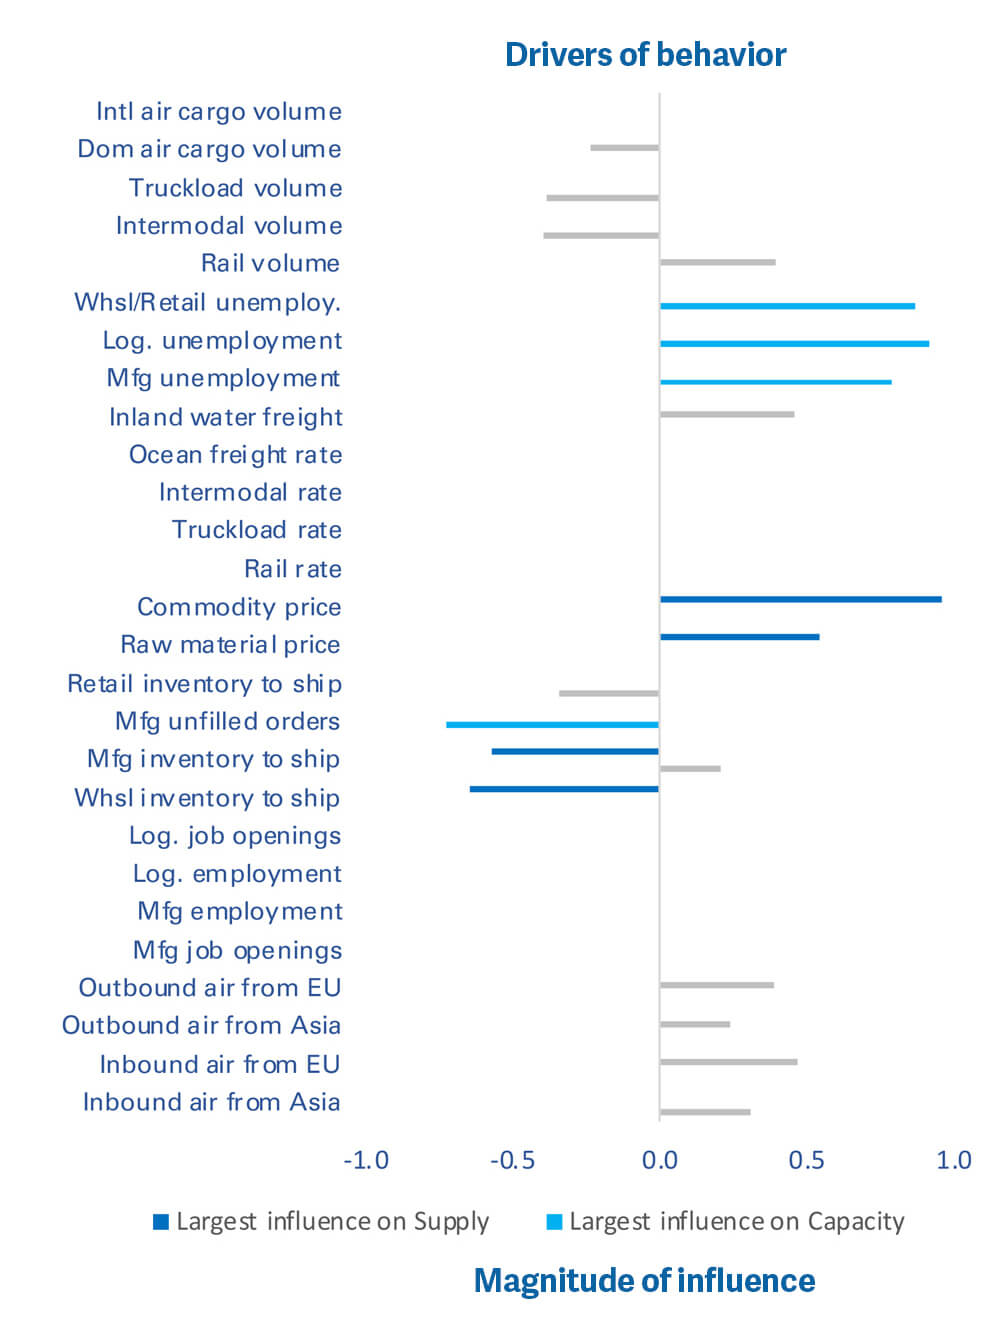
Capacity underutilization contributes 19 percent of the variance present in the index and is defined as the lack of labor efficiency in the job market. It is primarily driven by unemployment rates in manufacturing and logistics, which have been on a healthy decline since peaking in 2020.
This gradual stabilization of capacity stems from ongoing levels of attrition in what continues to remain a tight labor market in the United States.
In the new norm, there is a steady trend of voluntary attrition that is best characterized by the Great Resignation, and involuntary attrition that can be attributed to organizational “right sizing” measures taken to achieve cost efficiencies. A good example is Amazon, where earlier this year it reduced headcount by nearly 100,000 employees to help counter the pandemic-induced overstaffing of its fulfillment and distribution network.v
v The confusing job market: Tech and finance brace for the worst, retail is mixed, travel can’t hire fast enough, CNBC, Aug 2022
Attrition and commodity prices have the most influence.
With regards to tightness in the job market, as of July 2022 there is a 1.9 ratio of job openings to workers seeking work.vi Two job openings for every unemployed person means that workers who resign or lose their jobs are landing new ones almost immediately.vii Hence, workforce utilization remains strong with capacity continuing to regress back towards a more stable state of pre-pandemic behavior.
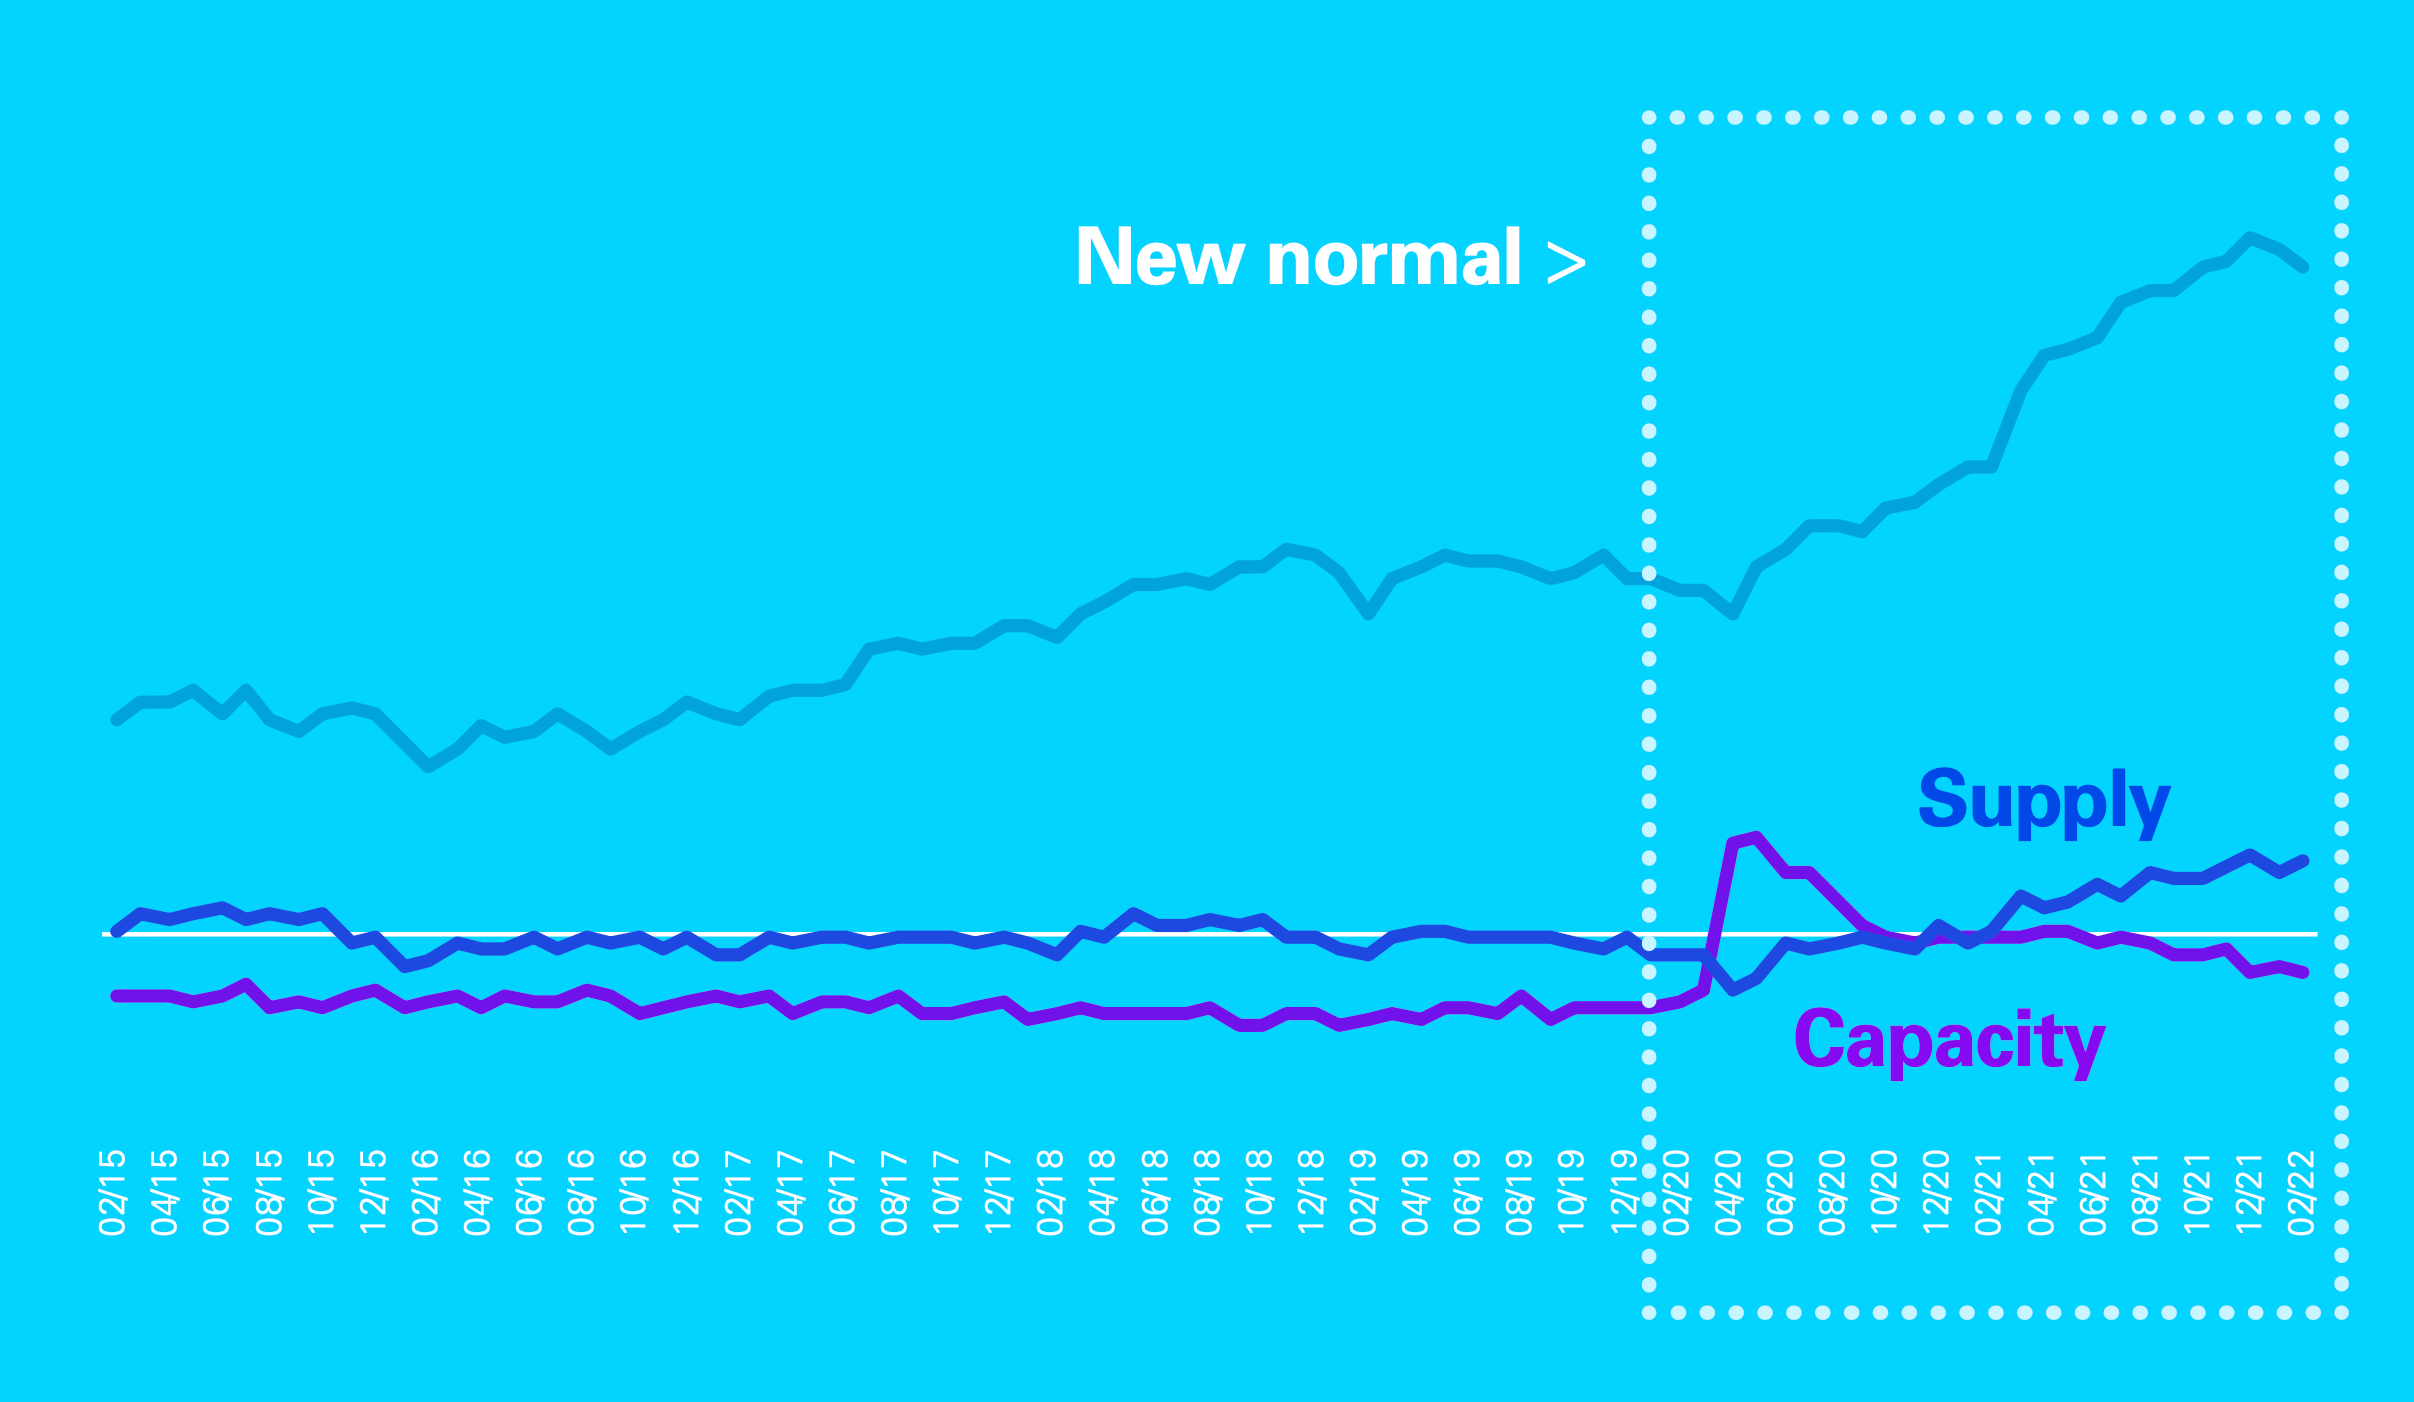
Supply is responsible for 10 percent of variability in the index but follows a trend line that is opposite to capacity. It is driven by the commodity and material costs required to produce inventory. And overall, it is on a gradual rise, having more than doubled in magnitude on an annual basis for the past two years.
Supply chain globalization has helped U.S. companies realize their ambitions of higher cost efficiency through low-cost sourcing, but it has also created a substantial dependency on offshore supply. And now, market volatility has turned that dependency into vulnerability, disrupting supply lines for commodities and raw materials.
vi Monthly Economic Updates: Workers Return in August, Chief Economist, KPMG LLP, Aug 2022
vii The Surprise in a Faltering Economy: Laid-Off Workers Quickly Find Jobs, Wall Street Journal, Aug 2022
Capacity and Supply are now moving on divergent paths.
The recent frequency and intensity of global market volatility has exposed what was once considered acceptable risks associated with a global supply base. As volatility increases, the premise of supply chain globalization diminishes.
©2022 KPMG LLP, a Delaware limited liability partnership and a member firm of the KPMG global organization of independent member firms affiliated with KPMG International Limited, a private English company limited by guarantee. All rights reserved.