
This is the last in a series of posts about operations and support for complex systems (or systems of systems), such as an electrical grid, railroad line, or assembly line. Such systems are nearly ubiquitous in business today, but we rarely consider their supply chain requirements until there is a problem.
In previous posts, we examined two critical aspects of system of systems management
- how advanced analytical methods, such as inventory optimization, can provide managers with the quantitative insights they need to manage a system’s operations and support (O&S) costs and performance
- the importance of stress-testing your sustainment strategy to predict system-level behaviors, such as overall performance and resilience to unforeseen events.
In this post, we’ll tackle another key element of complex systems management: the proper metrics for evaluating system performance.
Too often in business we use metrics of convenience. We select metrics because we have the right data or they are the output of the optimization technique du jour. In addition, most analytical optimization techniques maximize the performance of a subsystem or process against one or more metrics. Unfortunately, these solutions are not robust enough to meet the demands of systems of systems with a wide variety of logistics inputs and performance outcomes.
Managers of complex systems must start with the most important question: How well is the overall system supporting my customers? To determine this, you first have to know what metrics matter to your customers.
Let’s take two examples that we know well:
- Aside from safety, aircraft availability is crucial to an airline’s operations. However, the airline’s customers care about on-time departures, arrivals, and baggage delivery in the airport.
- Although equipment uptime is critical for a utility, its customers want uninterrupted delivery of power, phone, or water.
If system managers cannot view the system’s performance through their customers’ eyes, even the most well-intentioned metrics may lead to inefficient solutions. An equally important, but no less challenging, question for managers is, “How does each subsystem contribute to this overarching, customer-centric metric?”
To answer questions like these, managers can turn to simulations. Simulations are invaluable if you need a holistic measure of system performance as seen through the customer’s eyes. Fortunately, many simulation packages have data visualization capabilities that offer this customer-centric view of system performance.
Without this customer perspective, product or service delivery can seem successful but still be a failure. Systemic problems become readily apparent with visualization tools. For example, simulations can show if
- logistics process flows are bottlenecked
- some activities are overwhelmed with work while others are starving for work
- lend-users are receiving enough support to preclude interruptions in their operations.
Most simulation packages also have sophisticated built-in statistical capabilities that support the use of sensors to collect, aggregate, and statistically describe process activities. When used together, these visualization and analytics capabilities can give managers keen insights into the likely behavior of their system and its component subsystems under alternative O&S strategies, uncertain operating conditions, and the like.
When properly employed, a combination of analytical optimizations and Monte Carlo simulations offers a system of systems manager the ability to assess a system’s performance from the customer’s viewpoint.
Figure 1 compares a system’s mission coverage to its availability across a range of inventory investment alternatives. The blue line is the projected system availability from a readiness-based sparing (RBS) analysis. The red line plots the corresponding system’s mission coverage as generated from a Monte Carlo simulation.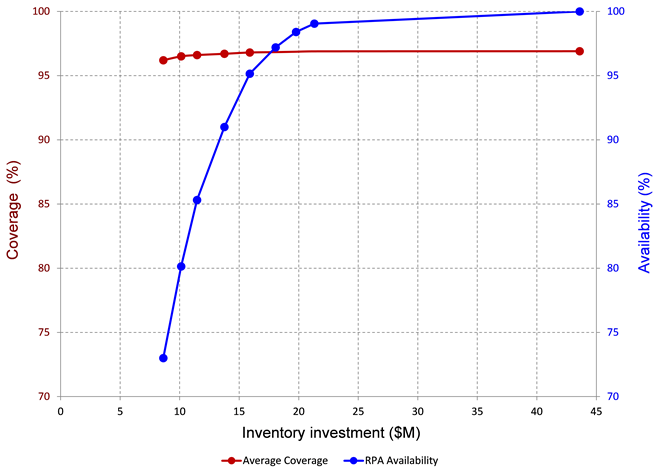
The availability curve has a distinct knee, which suggests availability—rather than coverage—is more sensitive to inventory investment, at least for this scenario. Note how the availability curve begins to flatten out around $20 million. The red mission coverage curve flattens out as well but around the $10 million mark. In this example, the recommended inventory investment is very different depending upon which performance metric is used.
When done properly, combinations of analytical and simulation analyses, like those described in my recent posts, can save organizations significant time, effort, and resources. But the best analyses start by understanding and then embracing what system-level performance or outcome is most important to your customers.
With this knowledge in hand, managers can more effectively use modern analytical optimization methods to manage their systems of systems.
David K. Peterson, PhD, is a senior consultant with LMI, specializing in readiness-based sparing. He has advised federal agencies on supply chain and operational analytics projects. His recent research on systems management and inventory optimization, co-authored with Vitali Volovoi, PhD, and Margaret S. Wise, appeared in the July/August 2016 issue of APICS magazine. Peterson also recently presented the APICS Extra Live webinar “Spare Parts Optimization for Complex Networks,” which is available on demand to ASCM Members.